


Core Web Vitals & Crawlability
Teardown: auditing slow WordPress site step by step
August 5, 2026
•14 min read
•Marko Jovančević
- 01Why does audit order matter more than the audit itself?
- 02Use the browser you’re already using every day for free
- 03Start with real-user data, not lab score
- 04Isolate TTFB before touching anything else
- 05How to measure TTFB – Time To First Byte?
- 06Read GTmetrix waterfall before making any changes
- 07Audit the database layer with Query Monitor
- 08Identify plugin performance drag
- 09Audit frontend assets: images, CSS, and JavaScript
- 10Evaluate hosting and server configuration
- 11Build a prioritized fix list, not a to-do list
- 12FAQ
Why does audit order matter more than the audit itself?
When you’re trying to audit a website, whatever you do, make sure to first use free tools available to you which, in combination, can tell you quite a lot about what is going on when used and interpreted correctly.
Most guides will tell you to optimize the images, enable caching, minify CSS and JavaScript but never tell why the things are the way they are, and why are they done in a certain way. To completely understand what is going on under the hood, I’m afraid you’d have to first understand how things work in WordPress. Everything else is just pure cosmetics if you do not have CLI access or at least standard SSH access and that is under the assumption that there are no paid plugins involved as well.
Use the browser you’re already using every day for free
Open Chrome Dev Tools (or any other preferred browser equivalent), hit the Network tab and refresh the page. This will list all sorts of information for you to find out where the real bottleneck is.
Using PageSpeed Insights you can find per page or per template where the issues are and fix them quite quickly. And if you’re having trouble with querying the database or have issues with WordPress’s way of fetching and displaying the data, you can also use Query Monitor to see where the information and issues are.
As mentioned in a previous post on the real costs hiding behind a slow website, please bear in mind that chasing pure 100 results, although very admirable, is pointless. Just pass the thresholds and you will be good to go.
So, let’s dig into the nitty gritty parts of things and see how to do a solid WordPress audit.
Start with real-user data, not lab score
I have covered this as well in a previous article but just briefly. Looking at the performance data, you can see two types of data; you can see what your real users are experiencing through CrUX, which you can learn more about in a previous article, and laboratory data.
Keep in mind that laboratory data represents the ideal scenario for running tests from a fixed server location. So, to find real user data, you would have to have Google Search Console up and running. The report you are looking for is Core Web Vitals report where you can see which url is passing, which has a Needs improvement warning and which ones have Poor statuses.
Your first and primary focus should be mobile devices and then desktop devices since Google is always indexing websites with mobile devices.
If you need live preview of your Core Web Vitals as you’re interacting with your website, in Chrome Dev Tools open “Performance” tab and you can see which element was interacted with and what the result was. Meaning, how long it took to make necessary change asked by your interaction.
Isolate TTFB before touching anything else
It is a metric measuring the delay between a browser sending an HTTP request and receiving the first byte of the HTML response. It all happens on the server level, before any asset loads and before a browser has anything to render.
A good TTFB or Time To First Byte is within the first 800 ms. Between 800 ms and 1800 ms it is in the zone of Needs improvement and anything above 1800 ms TTFB will have Poor status. Most commonly in WordPress, it is influenced by shared hosting servers not being fast enough, missing or misconfigured caching settings or excessive database queries executing on every page load, not to mention PHP versions as well. Old and not maintained themes can also play huge part in generating excessive queries, increasing TTFB as well.
How to measure TTFB – Time To First Byte?
You can use several tools to measure it. You can use field tools such as Chrome User Experience Report, or you could use web vitals JS library available to install via node package manager.
Or you could use tools such as:
- GTmetrix – https://gtmetrix.com/
- Chrome DevTools’ Network Tab
- PageSpeed Insights – https://pagespeed.web.dev/
Read GTmetrix waterfall before making any changes
Very similar to PageSpeed Insights’ Network tab, the GTmetrix lists a waterfall timeline of every network request a page triggers: from HTML, CSS, JavaScript, images, fonts, API requests and any other third-party scripts in their order of them being requested. The example of which you can see below.
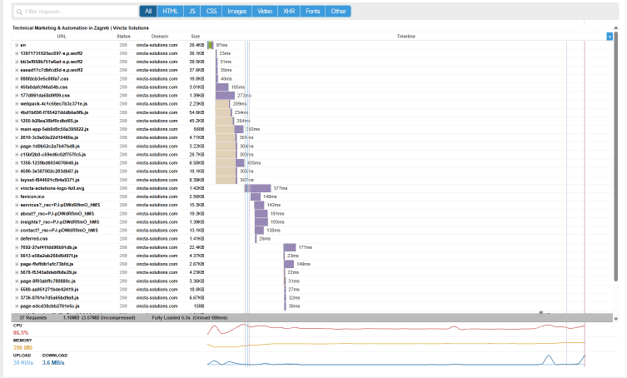
You should really pay attention to two things at the start of the audit here. The first green line and then the consecutive requests which are delayed by that green line. Those delayed requests are most used assets on your webpage such as fonts, CSS, JS and other scripts for various functionalities. To make it easier for you, GTmetrix enables you to filter through those types of assets and see all necessary details regarding those resources for you to establish where the bottleneck lies.
Bear in mind that this tool serves only as a diagnostic tool. Do not do any action at this stage.
Audit the database layer with Query Monitor
If you’re using WordPress to its full capacity and have any custom post types enabled (CPTs), when there’s an issue, don’t make the mistake of trying to debug it by yourself or with any AI tool available. The reason behind it is that neither you nor the AI can get to the full context of what is going on under the hood. And that is what the Query Monitor does.
It sheds light on what WordPress asks from the database trying to get to the information you requested as you can see in the screenshot below.
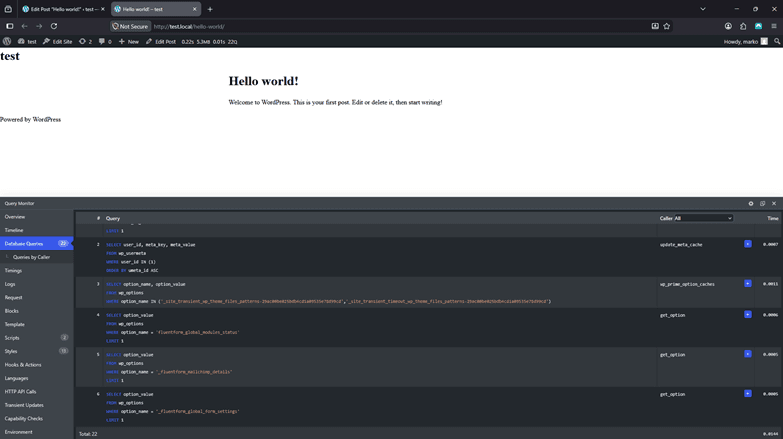
Query Monitor also gives you the surrounding context for each request, which is what makes it useful for debugging instead of just reporting numbers. Use the query count as a signal: staying below 50 database queries is a healthy target, while anything above 100 should be treated as a warning that something is loading too much data, repeating work, or querying the database when it should not.
The Caller column is one of the most useful places to start because it helps you move from “there are too many queries” to “this specific plugin, theme file, hook, or function is responsible for generating them.” Instead of looking at the total query count in isolation, filter by caller and look for repeated patterns: the same component running similar queries multiple times, queries fired inside loops, or requests triggered by functionality that should not be loading on that page at all. That is usually where the real optimization opportunity is, because once you know which part of WordPress is producing the load, you can decide whether to cache it, rewrite the query, disable unnecessary logic, or replace the component causing the overhead.
Identify plugin performance drag
When it comes to plugins, the question is not how many plugins WordPress installation has installed. It is what those plugins do when they are installed and activated.
E.g. How much bloat do they create when they’re put in use. So, to answer that question, the safest way to check that out is to use deactivation method after each of which you should measure the impact of that plugin deactivation. Sticking with the Query Monitor, after you have disabled certain plugin, you should then be able to see by how much the query count drops. If it drops by more than approximately 50 points, then you have found your culprit.
Most common issue makers are page builders who load their full asset stack on every page type, social sharing plugins making an outbound call on every page load or a session-heavy WooCommerce extensions running cart queries on non-shop pages.
Audit frontend assets: images, CSS, and JavaScript
After the server and query cleanup is done and everything is in order with no unresolved issues, it is time to focus on what the browser is downloading and rendering.
And that stage at this point is important because running those optimizations while having issues with the server and the database can backfire and put you in a backward loop making all things worse than they really are e.g. they can produce diminishing returns.
Easiest fix as well as largest-leverage target are the images which can account for approximately 37% (if not even more) of the page’s weight. At that point PageSpeed Insights will have displayed errors of oversized images with estimated savings. And, while making sure that the images are as light as possible, please set “width” and “height” on each one to reduce the chance of triggering CLS issues. And on the largest image above the fold in the template you’re using, do set fetchpriority=”high” which will prioritize that image when it starts to render the page thus improving your LCP score.
As far as CSS is concerned, you must detect which elements are critical to the theme you’re building and develop critical CSS, which typically is for the above the fold content when the page loads. It is therefore important to inline it with HTML using <style> element in the <head> element of the document. When it comes to JavaScript, not every script in the document head is a problem — identify which ones are genuinely required before first paint and which are safe to defer.
Evaluate hosting and server configuration
If TTFB checks out from the earlier steps, then this is just a quick configuration precautionary inspection. If your TTFB were to be slow and the database and plugin audit found nothing significant, then hosting is the likely ceiling, and this section becomes more critical.
There are three server-side variables that affect WordPress performance directly:
- PHP version
PHP version 7.4 reached end-of-life in November 2022 and sites still running it could experience meaningful throughput improvements with PHP 8.x in benchmarks.
- OPcache status
In your WordPress dashboard there is a Health check screen which can show you information if OPcache is activated or not. You can get to that screen by going to: Tools -> Site Health -> Info -> Server
If it is deactivated, that means that every PHP file is parsed from scratch at every request and enabling it has no downside for a production WordPress site.
It is used primarily to compile each PHP file and store those files in memory thus eliminating the need for repeated parsing.
- Object caching availability
Object caching is a technique where the result of an expensive operation — like a database query or computed value — is stored in fast, temporary memory (like Redis or Memcached) under a unique key after it’s first generated, so that future requests for the same data can be served instantly from that stored copy instead of being recalculated or re-fetched from scratch. Cached copy typically expires or is invalidated once the underlying data changes and is typically used alongside with the OPcache for best performance.
Build a prioritized fix list, not a to-do list
Once you have all the data, it is important to put the structure to the action plan on trying to solve all the problems. Do not make mistakes of making a simple to do list. That is not the way to go.
We have covered everything regarding priorities in this article, so go with it:
- Resolve anything which would reduce TTFB and eliminate any insufficient database queries – both of which will affect every subsequent measurement
- Fix any assets affecting your LCP and CLS scores – from images (fetchpriority, width, height), JavaScript (defer non-essential scripts), CSS (inline critical CSS for above the fold content)
- Fix smaller assets which provide less impact when fixed but when it all adds up, you could see incremental improvements – font loading, browser-caching etc.
Measure after every individual change, not after batching ten fixes at once. Batching makes it impossible to know which change moved the needle and which did nothing — and it makes it impossible to catch a fix that made things worse.
Need a hand with your WordPress audit?
TTFB, query counts, plugin bloat, render-blocking scripts — sorting out what’s actually slowing your site down takes the right order of operations, not just the right tools. If you’d rather skip the guesswork, get in touch and we’ll walk through your setup together and map out what’s worth fixing first.
FAQ
Under 200ms is the target for a cached page response. Google classifies TTFB as ‘needs improvement’ between 800ms and 1800ms, and ‘poor’ above 1800ms. For uncached responses — where WordPress generates HTML from PHP and database queries — under 600ms is a reasonable benchmark on well-configured shared hosting. Managed hosting with object caching enabled should consistently serve cached pages under 100ms.
A typical WordPress page should run under 50 database queries. Simple sites with a lightweight theme and few plugins often run 20–35 queries. Once you cross 100 queries per page load, it’s worth investigating the source — use the Query Monitor plugin to identify which plugin or theme function is responsible. WooCommerce pages naturally run more queries, but 150+ on a product page usually indicates a misconfigured extension.
It depends entirely on which plugins you deactivate. Plugin count alone is not a reliable predictor of speed — one poorly written plugin making 60 redundant database queries causes more damage than fifteen well-coded ones combined. The deactivation test works best when paired with Query Monitor data: deactivate the specific plugins identified as query offenders, measure TTFB and query count after each change, and only draw conclusions from the measured difference.
The most common causes are oversized or uncompressed hero images that take too long to download on a mobile connection, missing fetchpriority=’high’ on the LCP image element (which means the browser doesn’t prioritize loading it), and render-blocking JavaScript that delays the browser from painting anything above the fold. A high TTFB compounds all of these — the browser can’t begin loading the LCP image until it receives the HTML, so a slow server adds directly to LCP time.
Cleaning expired transients and orphaned plugin options is safe and commonly recommended. The risk comes from removing rows that active plugins or WordPress core depend on — deleting those breaks functionality. Before cleaning, identify rows by their option_name, confirm which plugin created them, and verify that plugin is no longer active. Avoid using bulk-delete SQL queries without reviewing the specific rows first. Always take a database backup before any manual cleanup.
Fix TTFB first, always. TTFB is a server-side delay that occurs before any asset — including images — begins loading. Compressing images on a site with a 1.2-second TTFB will produce a negligible improvement in real-user load time because the browser spends the majority of the wait time waiting for the HTML to arrive. Resolve hosting, caching, and database query issues first. Once TTFB is under control, image optimization produces its full expected impact.
PHP 8.2 or 8.3 is the current recommendation. PHP 7.4 reached end-of-life in November 2022 and no longer receives security updates or performance improvements. PHP 8.x versions show measurable throughput gains over 7.4 in WordPress benchmarks — more requests handled per second with lower memory usage. Check your current PHP version in WordPress dashboard → Tools → Site Health → Info → Server. Most managed hosts allow a one-click PHP version upgrade from their control panel.
- One call
Not sure what's broken? That's what the call is for.
A short call to review your current setup and figure out what's worth fixing — and in what order.
Book a free call- Related articles
- Analytics You Can TrustThe GA4 Conversion Tracking Failures That Never Throw an Error5 min read
- Analytics You Can TrustMaking decisions on bad analytics data — here’s what that actually costs8 min read
- Core Web Vitals & CrawlabilityWhy is page speed not the only thing to optimize for?6 min read
- Author

Marko Jovančević
Marko Jovančević | Technical Marketing & Automation Specialist | Zagreb
More about us →